spectrum management
That CTIA Flag Chart
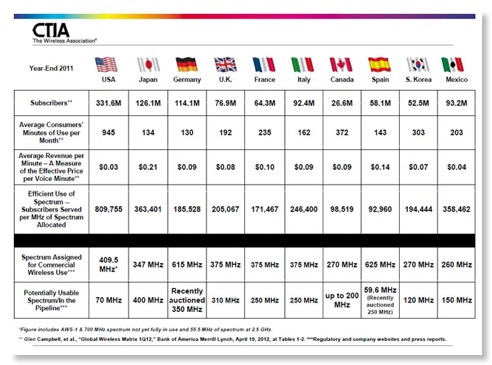
For at least 2 years CTIA has been using the above chart, including minor variations, as part of its justifications for more allocations for cellular licensees. Your blogger does not disagree with the basic need for such allocations.
But it is interesting to look at the logic of this chart. Note the 3rd row “Efficient Use of Spectrum -- Subscribers Served per MHz of Spectrum Allocated”. In the US the value is 809,722 while in Spain it is on 92,960. Wow, Spain must be a great place!
Now let’s extend this logic. Let’s take the CIA World Factbook as a source of population data. Vatican City has a population 826 and has the same 375 MHz cellular allocation as Italy, so it has an “Efficient Use of Spectrum” of 825/375 or 2.2. They must have great cellular connectivity! Cellular nirvana.
How about San Marino, population 32,140 with an “Efficient Use of Spectrum” of 85.7 Supernirvana!
Click map to enlarge
The real point is that spectrum efficiency really is important. But spectrum lobbyists are reducing arguments to absurdity by trivializing technical issues in the high stakes game of spectrum allocations. It is amazing that CTIA has used this nonsensical metric for so long and it reflects on both CTIA and many of the government officials they deal with that they have been able to use such garbled thinking for so long.
Spectrum efficiency is generally thought of including more than population and amount of spectrum, area is a key issue. Frankly, it doesn’t make much sense to deal on spectrum efficiency with a country as a whole, since demand varies greatly in different areas in countries larger than Vatican City. A much better metric is peak population/area/MHz.
Now maybe this is too confusing for spectrum lobbyists and the officials that they deal with, but misleading information like the “flag chart” detracts from the real issues.
Can’t we have a spectrum dialogue with real facts, not phony metrics made up by spectrum lobbyists and PR firms?
Comments


 (Does not include readers using RSS feeds.)

![[Valid RSS]](valid-rss-rogers.png "Validate my RSS feed")

