Dueling Spectrum Charts
Like the “dueling banjos” scene in Deliverance, we now have dueling spectrum charts with the release this week of the FCC White Paper The Mobile Broadband Spectrum Challenge: International Comparisons, produced jointly by WTB and OET.
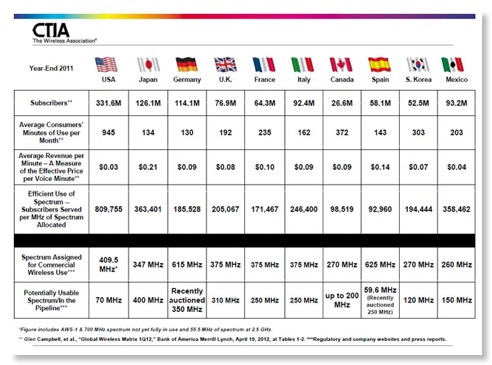
Reader may recall the recent criticism here of CTIA’s long used chart shown below:

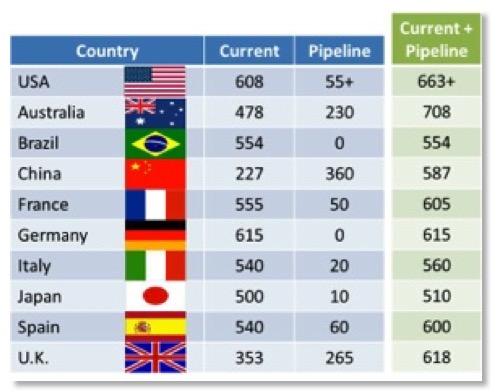
Now FCC has answered back with its own accounting of international mobile spectrum use:

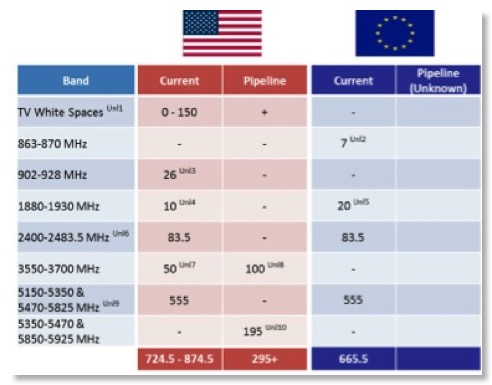
Now FCC does not use the absurd CTIA metric of “subscribers served per MHz of spectrum allocated” previously discussed here. And FCC adds data on unlicensed spectrum, often used by the cellular establishment for offloading traffic and thus improving service but almost always opposed by the cellular industry.

Clearly there are some major difference between CTIA’s accounting and FCC’s. For example FCC finds 608 MHz of “mobile broadband” spectrum now in the US, while CTIA can only find 409.5 MHz of “spectrum assigned for commercial wireless use”. At least in the UK the numbers are closer, FCC finds 353 MHz while CTIA finds 375 MHz. In the case of Japan, FCC finds 500 MHz of spectrum while CTIA can only find 347 MHz.
Hopefully both sides will explain what exactly they added up to get to the bottom of this disagreement. However, in the country with the world’s largest most information intensive military and with a severe post 9/11 public safety problem, it should not be surprising that less spectrum is available for commercial wireless then in, say, Brazil. If the cellular community was more open to spectrum sharing, rather than just trashing the PCAST report sharing recommendations, we could have more commercial wireless use as well as public safety/defense use.
blog comments powered by Disqus


![Validate my RSS feed [Valid RSS]](valid-rss-rogers.png)

